15th February 2019

The latest Quarterly Dynamics publication from the Australian Energy Market Operator highlights how the growing penetration of solar – both rooftop and utility scale – is continuing to reshape the grid, along with growing amounts of wind and greater energy efficiency.
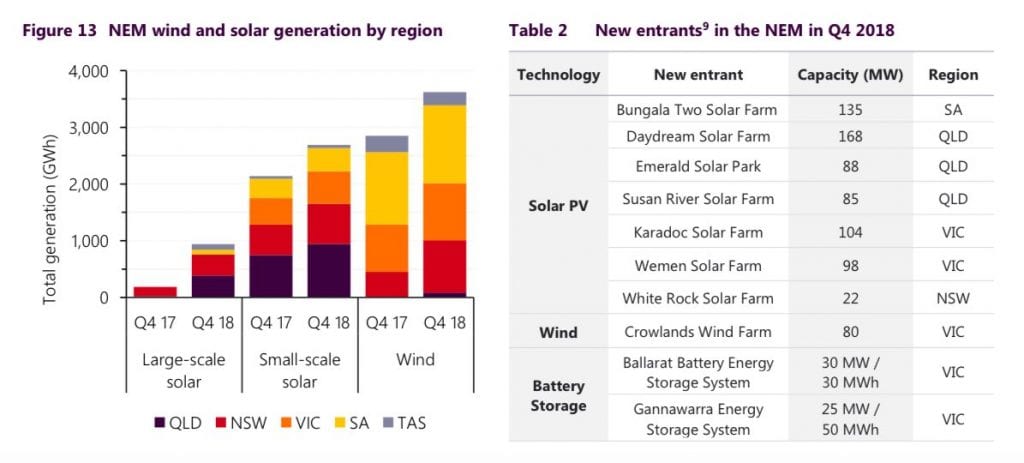
The Quarterly Dynamics notes that solar has been the biggest single change in the energy mix in the latest quarter, with output from rooftop solar PV generation jumping 26 per cent to 2,140GWh, and the combined output from rooftop solar and large scale solar jumping 56 per cent to 3,681GWh.
The average daily peak generation of rooftop solar PV increased 25 per cent to 3,878MW.
This graph above illustrates the growing profile of solar generation, both rooftop and utility scale, the latter of which has grown exponentially in the last year as numerous solar plants come on line.
AEMO noted that seven new solar farms totalling 700MW capacity commenced generation in the fourth quarter, with half of this in Queensland, just over one quarter in Victoria and 20 per cent in South Australia (mostly the Bungala solar farm).
In comparison, there was just one new wind farm that commenced generation in the quarter – the 80 MW Crowlands Wind Farm in Victoria.
 Another perspective of the change in supply is illustrated here. With the change from the 3rd quarter illustrating the growing influx of solar in the generation mix.
 This is having an impact in certain parts of the grid. As we reported at the time, South Australia also recorded its record low operational (grid) demand in October, when it fell to just 599MW at 1pm (grid time) on October 21.
- This was 62MW lower than the previous record and AEMO says this represents a continuation of the decreasing average demand trend in the region, primarily driven by increasing rooftop PV uptake.
The growing level of solar PV is also reducing demand in Western Australia. Rooftop solar in that state went past 1GW during the quarter, and on October 31 the state’s Wholesale Electricity Market (WEM) recorded its lowest operational demand for 2018 of 1199MW.
This was the lowest demand in the fourth quarter since 2007, and just 26MW above the all-time minimum demand since the WEM was created in 2006. Again, the increased in rooftop PV capacity and mild temperatures were the primary causes.
However, AEMO says the growing share of rooftop solar also caused it to call on its Load Following Ancillary Services for the first time ever on October 18, when load fluctuations of up to 150 MW (primarily due to large swings in solar PV and compounded by changes wind output) increased the magnitude of frequency fluctuations on the system.
A total of 50MW of Backup LFAS Down and 50MW of Backup LFAS Up was enabled for 3.5 hours to meet the volatile load profile and maintain system frequency within tolerance, AEMO said. This cost consumers and non-scheduled generators around $36,000.


