
26th July 2017
“We will fight for bovine freedom
And hold our large heads high
We will run free with the Buffalo, or die
Cows with guns”
Cows with Guns, Dana Lyons 1996
Grid arbitrage is becoming more attractive. You’re a fool if you don’t have rooftop solar PV and you could.
Grid delivered electricity is going up in price …. never mind the impending generator reliability obligation or gas prices or even the market oligopoly, the persistent underlying driver in the household sector is rising regulated monopoly network prices.
If networks continue to invest and household volumes continue to fall it will result in higher unit prices. Household are only 1/3 of electricity consumption, but they account for more than 80 per cent of network revenues and retail profits.
This note shows that solar PV + battery storage is now reasonably clearly economic in NSW, provided you have the roof space and the money.
A 6kW solar PV system and a 13kWh Tesla Powerwall 2.0 battery storage unit can probably be had for less than $20,00 with some shopping around.
If you assume that lasts for 25 years and 100 per cent of the electricity is used behind the meter, the IRR (internal rate of return) is about 15 per cent and the payback is about 7 years.
That’s very attractive when mortgage rates are 5 per cent, or even less. It’s hard to prove, because details on maximum demand costs are not shared, but we expect that batteries and PV are even more attractive for small and medium size business than they are for households.
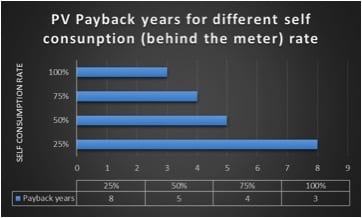
PV on its own is now hugely attractive to households: it provides a 5 year payback if you use 50% behind the meter.
How will this play out is yet to be seen, but the ongoing competitiveness of behind the meter generation and storage will force a grid response.
Politicians will likely end up supporting calls for more of networks bills to become fixed. Another option in theory is for networks to reset and write down some of their RAB (regulated asset base). That won’t happen in a hurry.
In fact right now networks aren’t really feeling the pain because they just pass it on to their grid connected customers.
Make sure you know what the real debate is
So the debate is not really about whether it should be pumped hydro or utility scale batteries or more gas to keep the system going.
The underlying real debate continues to be the system v distributed electricity.
Behind the meter PV in the past 6 years has totally dominated all investment in generation and has been totally beyond the control of the existing players.
Now that batteries are competitive, stage 2 of this takeover is about to proceed.
Will storage further empower the consumer?
There’s no doubt there is a boom in renewable energy.
Wind and PV projects are springing up all over the place and there are more coming.
This is of course great, but as Reneweconomy has documented there is also a resurgence in rooftop PV.
All of this extra non firm capacity has put additional pressure on the value of firming.
The firming solutions that are on offer right now are:
- Reconfiguration of existing hydro resources to move from providing mainly energy to providing mainly firming power. For instance as more wind is built in Victoria, Snowy and Southern Hydro can move back to more of a peak role. Perhaps a better example is the potential for HydroTasmania to move from a role of mainly supplying energy to Tasmania to one of supplying firming power to the NEM. If enough transmission was built and some other reconfiguration HydroTasmania could supply about 2.5 GW of firming power to the NEM.
- Building more pumped hydro in Australia. That’s what the $4 bn ($2 bn for the project and $2 bn for the transmission) Snowy 2.0 project is about. However there are also two smaller projects where the planning is at a far more advance stage. One is Genex’s Kidston project and the other is EnergyAustralia’s proposed Cultana saltwater pumped Hydro plant in South Australia. In addition we have the Blakers concept of a massive pumped hydro build out backed up by HVDC transmission backbone.
- Existing or new gas plants. Our sole comment here is that as we see strong decarbonisation momentum gathering pace over time, the value of gas plants isn’t all that apparent. That said we are keeping an eye on the gas “resources” in the Northern Territory particularly at Origin Energy’s Beetaloo field.
- Ongoing flexibility increases of the existing thermal resources. We note that Australia’s electricity demand has always been quite peaky and the existing coal system copes well. There are technological innovations that maybe able to do more with the existing coal plants.
- Battery storage. We are going to focus on lithium batteries. In contrast to almost all the other technologies here batteries like PV can be decentralised. A battery can be as small as a watch battery or as large as 100 MW. That’s why batteries have a unique role in taking the consumer driven “hybrid system” forward.
- Demand response. Demand response is not a technology that has really had much of a run in Australia but there is a growing bandwagon of supporters. We ran out of space to talk demand response in this piece but keep your eyes peeled as it’s a hot topic that we are keen to cover.
- Possibly CSP plants might have an impact. Right now there are not enough working examples to form a view. For instance the Crescent Dunes project has been offline for six months due to molten salt tank leaks. We understand its restarted but we doubt there will be any official data to show capacity utilization prior to the December Quarter.
Pumped hydro v batteries
When set up as a straight cost comparsion pumped hydro can be made to look quite good. The cynic might almost ask, “if its so good why is there so little of it?”.
It has after all been around for years and there is no technology risk.
How much does pumped hydro cost?
Well it’s a project by project estimate.
Each one is different.
And there’s the nub.
Further the perspective on the cost of pumped hydro might look different from the system’s perspective as opposed to the individual developer’s perspective.
And this relates to the Generator Reliabity Obligation. In other words from the system’s perspective if all you need is a “little bit” of pumped hydro spread across a lot of volume it might be cheap.
On the other hand and individual pumped hydro project that has to compete for say merchant revenue might look quite expensive.
EnergyAustralia/MEI/ARENA’s proposed Cultana, salt water hydro plant in South Australia can be considered as a merchant plant.
Although we understand formal costing has not yet been received, EnergyAustralia provided some indicative data at the recent EnergyStorage conference.
We took some numbers off the graph and compared them with the numbers Andrew Blakers employed for the ANU 100% renewables study.
The point here is that Cultana is coming in at a higher capital cost (it does included transmission connection). Pretty much double. Note Cultana is saltwater.
We estimate that adds maybe 10% to capital cost. We might be wrong. On our numbers assuming 70% capacity utilization, that is volume of about 400 GWh per year Cultana would need to average $88/MWh to wash its face.
That $88/MWh is the required spread between the price it pays for electricity and the price it sells at. In our view as a merchant plant, and even in South Australia, that won’t be a “gimme”.
On the other hand we would say Cultana has likely had a quite a lot of detailed work to get to those numbers. Genex’s Kidston plant is cheaper, but benefits in that its storage is pre built, sort of.
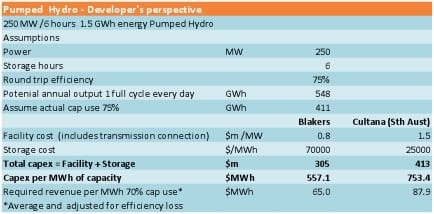
Figure 1: Capital and energy costs of pumped hydro. Source: Blakers Report, EA presentation to storage conference, ITK calculations
Of course all these giant utility scale plants take lots of capex, lots of financing, lots of environmental discussion and take years and years to build.
Hand up if you know when Snowy 2.0 will be up and running?
Answers on a postcard please but if its four years it’ll be great.
What about batteries?
Well, frankly the first piece of BS that needs to be sorted out is the cost of utility scale batteries.
This is an important topic shrouded in mystery. We know lots of things about the South Australian big battery but not its price/cost.
This is garbage and similar to Esso/BHP hiding the price they charge the likes of AGL for Bass Strait gas. Nor do we necessarily see the problem as caused by the South Australian Government. In California none of the three separate Aliso Canyon battery suppliers have revealed the cost of the battery.
There are plenty of other examples.
And then we have the debate about capacity v power.
Lithium batteries at the household level are generally configured to look cheaper in terms of energy than in power. Take the Powerwall 2.0, it does 13 kWh of energy but only 5kW power. So the capital cost per kWh is less than half what the capacity cost in terms of kW is.
In terms of energy reading off the EnergyAustralia graph, but after lowering cost by 10 % for saltwater we compared the energy capital cost of batteries v pumped hydro in Fig 2.
For batteries we used the Tesla Powerwall 2 as a starting point.
Tesla does not reveal the cost of the larger (up to 200 KWh) Powerpack but a few online estimates suggest its not that different to the Powerwall in $KWh of energy capacity.
That number gets you to about A$650 KWh before installation.
We allow lithium unit costs to reduce 3% per extra hour of storage required.
This comes from moving from containers to buildings, spreading air conditioning and fire suppression costs, building vertically so lower land cost per unit etc.
Note that this is not an NPV estimate but a capital cost .
The battery will likely not last as long as the pumped hydro. Pumped hydro could easily last 40% years. Still its instructive for someone looking for something in a hurry.
We’d argue that at least up to 3 hours of storage lithium’s scalability (ie install in 10 MW increments) and speed of deployment would easily justify the cost difference to pumped hydro as used for time shifting of energy consumption.
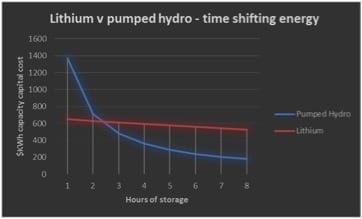
Figure 2: Lithium v pumped hydro capital costs in $KWh of energy capacity. Source: EA, Tesla, ITK
On a $MW power basis though, we think right now Pumped Hydro is pretty much as cheap as lithium batteries.
It’s behind the meter v in front of the meter that matters
The real point of this note though is that only batteries can move behind the meter. Once you move behind the meter you can “arb the wires and poles”.
According to www.solarchoice.com.au the median installed cost of a 4 KW system is around $1.14 watt in July 2017.
After allowing for discounts (Origin for instance has 24% off the ex-gst usage price) the cost of electricity in Sydney works to about $0.30 KWh. So on that basis even if you use just use 50% of your PV behind the meter payback is 5 years and the IRR 22%.
Adding in a battery requires a more complex calculation.
Specifically you really want to avoid peak charges and maybe shoulder charges.
Many householders, most, aren’t aware of how much electricity they consume at peak, even if they have a time of use meter. You have to adjust for weekends. It’s a pain.
For business there are generally peak charges based on the maximum KvA (power adjusted for power factor) to be considered.
The business themselves may know what they are but an analyst trying to generalise from outside has no idea.
So the size of the opportunity in batteries in the business world is hard to estimate. That said, my opinion, is that batteries have a big part to play in medium size business but the sales teams may have trouble reaching the decision makers.
So for this analysis lets stay with households. Details of Origin Energy (for instance) pricing plans in the Ausgrid area can be found at:
Peak charges are 58 cents KWh and shoulder 26.2. ORG offers as much as a 24% discount off the ex GST usage charges for online, direct debit. We average all that out to 30 cents KWh near enough.
The fixed grid connection charge is $334 per year. Unavoidable if you stay on the grid and great value.
We assume the installed cost of a Powerwall 2 is $11000 and 6KW of PV costs $6840 with average annual output of 7.4 MWh and average daily outut of 20 KWh (this will vary over the seasons).
On this basis we calculate a payback of 7 years and an IRR of 15%.
In our view an IRR of 15% is attractive.
The assumption is that 100% of the PV is used behind the meter thanks to the battery, and that all the battery is used each day to avoid peak and shoulder grid charges.
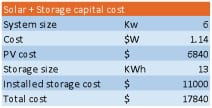
Figure 3 Less than $20 K for a 6 KW system with Powerwall. Source: Solarchoice and Tesla
The Internal rate of return model ( a simple one is shown below).
You can question whether the battery will last 25 years.
You have to have enough roof space for 6kW. You have to have $20,000. You could make some allowances for efficiency losses.
All that said we have used a flat $0.30 KWh as the benchmark.
If retailers and networks don’t get any price increases over the next 25 years there will be some fairly grumpy financiers.
NB: that we don’t use 5% cost of capital in an IRR model and in this case the sell to grid price is not relevant. 6 KW will on average charge the battery once a day and leave 7 KWh over for other self consumption, ie typically to run the house in the middle of the day (washing machine, fridge, swimming pool, dishwasher, electric jug, some airconditioning in Summer).
At the moment with the sell to grid price of around 10 cents KWh and discounted off peak price buying from grid around 12.4 cents KWh are close.
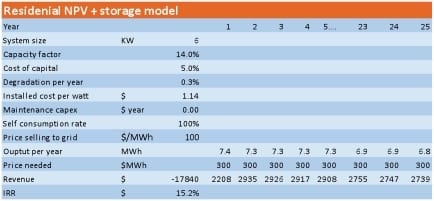
Figure 4: IRR model showing positive return for PV + battery. Source: ITKe
An increasing number of houses and businesses are at tipping point and this may put further pressure on networks
Here is the real kicker to this analysis. The economics are now increasingly in favour of partial grid defection.
That is to say it’s easier and easier to see numbers that support putting in a battery and a PV system. We aren’t talking for the most part 1 or 2 KW systems but 5 KW and larger systems with batteries.
If it’s worth it for residential in NSW, it’s almost certainly going to be more economic for businesses that consume most of their power in peak and shoulder periods and also face expensive maximum demand charges.
Every kWh that doesn’t go through the grid will tend to make the grid more expensive.
We already know that the main reason electricity prices have more than doubled in the past decade is that networks over invested at the same time that consumption was falling.
It wasn’t just the investment it was the falling consumption.
This analysis supports the view residential and business consumption growth in aggregate is more likely to be negative than positive.
The impact is to put ongoing upwards pressure on grid delivered prices. We expect networks will react to this by further adjustments to tariff structures.
More and more we will see flat monthly charges for grid connection, perhaps supported by demand management reward.