
Please note that the information below is based on example information and that you should consider this advice for illustration purposes only. Each real circumstances have different patterns of energy use and system sizes.
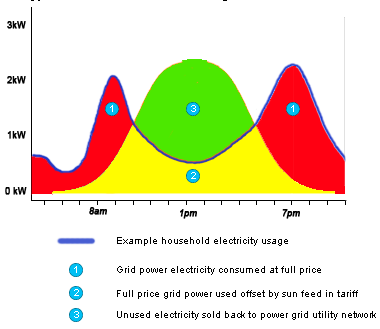
| To the right is a typical direct grid tied benefit diagram. Notice the amount of full price energy consumption in red (1).The green area (3) is the amount you feed back to the grid for a feed in tariff that varies depending on the market at the time you negotiate the rate. The yellow area (2) is where both the sun and the grid power are combined together to power your house. The price you pay here would be the normal price you pay for electricity minus what you receive back for your feed in tariff which is normally significantly lower than the normal price you pay for electricity. | Typical Direct Grid Tied Benefits Diagram without Batteries
|
So we see that by having your solar system connected directly to the grid, there are benefits, however the household is still paying a large percentage of either full price electricity or off-set full price electricity. With the direct grid tied system, the leftover electricity in green is being sold back to utilities often for extremely low rates so they can on-sell to other households for the full price. So looking below we illustrate some examples of battery implementation.
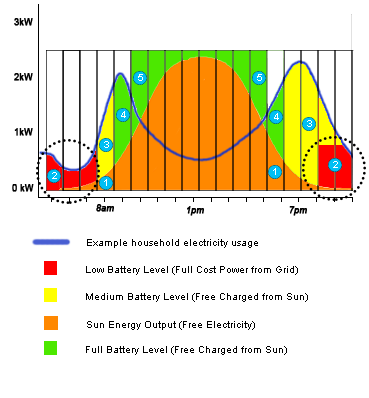
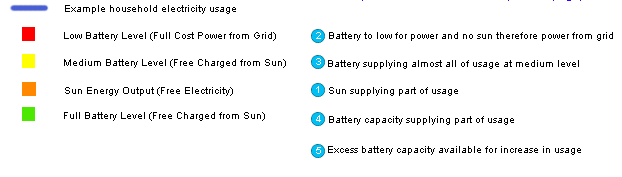
| Small to Mid scale Battery Installation Benefit Diagram | To the left is a small to mid scale installation example with a small battery bank. Note the significantly reduced full price energy consumption in red (2). At approximately 5pm we see the sharing of both the sun (orange, 1) and the battery supply (green, 4) to fulfill usage demands. As we begin to increase our electricity usage during the evening, our battery reserves are supplying almost all of the usage (3) until they become too low to supply, at which point grid power turns on (2). Looking now just before 8am we see the sun begin to come out and begin to supply power to the home and the battery reserves, filling the batteries for when they are needed next.  |
Now that we have added a small amount of batteries, we have completely changed the way in which we use the energy from the sun. By using the batteries to store a reserve of sun power for when we really need it most, we significantly reduce the amount of money that we are spending on full cost power from the grid. Below we look at a slightly larger amount of batteries and the affect it has on the overall supply vs demand comparison.
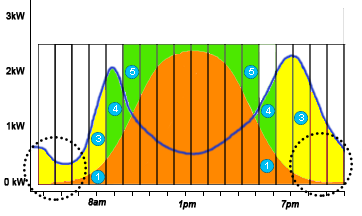
| To the right is an example showing that we have the correct amount of batteries to completely rely on sun powered energy without the need for full cost power from the grid. Note that the areas that were once red in the example above, are now yellow which shows that all the energy demands of the household are being met by the batteries. So with this example, we see that at the lowest point being the yellow area we are still getting free electricity charged from the sun. | Full Scale Battery Installation Benefit Diagram
|
So to conclude, we see that by adding a scalable battery solution to a solar model or a pre-existing grid tied installation, we can significantly reduce the monthly expenditure of full cost power from the grid. It is clear that it is worthwhile exploring the available options that we have to ensure we are using tools to our maximum benefit.
To find out more and to order our systems please contact us.